Struggling with supplier performance? You’re not alone. Many businesses rely on outdated, inconsistent rating systems that fail to deliver actionable insights. Here’s why most systems fall short and how to fix them:
- Bias and subjectivity: Gut feelings often replace measurable data, leading to inconsistent evaluations.
- Disconnected tools: Manual spreadsheets and scattered data create errors and delays, making decisions outdated.
- Missing critical metrics: Key indicators like variability in delivery times or defect trends are often overlooked.
- Lack of real-time updates: Static systems can’t keep up with dynamic supply chain risks.
The solution? Modern, data-driven systems that focus on key metrics like quality, delivery, cost, and responsiveness. Using structured data and weighted scoring methods ensures fair, consistent evaluations. AI-powered platforms take it further by automating updates, analyzing trends, and flagging risks early. For those looking to upgrade, reviewing the best supplier rating systems can help identify the right fit for your tech stack.
Want to avoid costly disruptions and boost supplier reliability? Start by prioritizing clear metrics, integrating tools, and leveraging real-time insights.
Supplier Performance Matrix Explained | ISO 9001 Clause 9.3.2 | Lean Alternative to Scorecards
sbb-itb-633367f
Why Most Supplier Rating Systems Don't Work
Many supplier rating systems fail because they lean too heavily on personal judgment instead of relying on solid, measurable data. When procurement teams let gut feelings guide their decisions, bias creeps in. For instance, a buyer may stick with a long-time supplier out of loyalty, even if that supplier's delivery reliability has started to falter. Without clear, standardized criteria, different evaluators might rate the same supplier in wildly different ways, resulting in inconsistent comparisons - making it nearly impossible to evaluate suppliers fairly.
"Ambiguity creates bias. Teams over-index on the last demo, miss constraints... and discover must-haves late."
– Priyanshu Anand, TechnologyMatch
This issue is further compounded when vague scoring systems allow evaluators to adjust scores retroactively to align with preferred outcomes. Ambiguous metrics open the door for these post-hoc changes, undermining the credibility of the entire process. It's no surprise that 87% of procurement professionals now cite managing supplier risk as their primary concern, even though many still rely on systems that can't back up decisions with concrete evidence.
Subjective Scoring Without Clear Standards
When rating systems lack defined criteria, evaluators are left to interpret priorities on their own. Without specific weightings - like assigning 30% to quality, 25% to delivery, and 20% to cost - each person may emphasize completely different factors. One team member might prioritize price savings, while another focuses on lead time reliability. This inconsistency makes it nearly impossible to compare suppliers objectively or defend sourcing decisions to stakeholders.
Jason Calacanis, founder and CEO, highlighted this challenge:
"My team was fighting me on saving money... 'I love this vendor' and 'they were loyal to us' and 'this is a waste of my time.' My team started to understand we were being ripped off [once we used data]."
Without weighted criteria, evaluations often reflect personal preferences rather than actual performance. And given that supply chain disruptions can erase 62% of a company's profits, this lack of objectivity is a risk no business can afford. It also sets the stage for further complications when it comes to managing and interpreting data.
Manual Data Entry and Disconnected Tools
A surprising number of companies still depend on manual spreadsheets and disconnected systems, which are riddled with opportunities for error. Manual data entry has an error rate as high as 4%, meaning even a single typo or misplaced digit can drastically distort a supplier's performance metrics. The costs of these errors add up quickly - for every $1 spent on preventing data errors, companies spend up to $10 fixing them.
"Manual data entry is inherently prone to errors. Typos, misplaced digits, or skipped entries can have a ripple effect across supply chain operations."
– Harmonie Poirier, Head of Marketing, OrderEase
Beyond errors, manual processes often create fragmented data systems. Pricing might be tracked in one spreadsheet, quality control issues in another, and delivery timelines in yet another. This lack of integration means there’s no single source of truth. It's no wonder that 72% of companies struggle to manage data across disconnected tools. By the time quarterly reviews are compiled manually, the data is already outdated - leading to decisions based on historical, not current, supplier performance. And even worse, many systems fail to capture the most critical performance metrics.
Missing Critical Performance Data
Traditional supplier rating systems often focus on the wrong metrics - or fail to collect essential ones altogether. For example, they might record an average on-time delivery rate but ignore the variability behind that number. A supplier with a high average delivery rate could still be wildly inconsistent, causing significant disruptions to production schedules.
"Supplier performance problems rarely appear all at once. They show up in small gaps: a delivery that slips a few days, a price that changes after a purchase order is issued, or a supplier commitment that was never clearly confirmed."
– SourceDay
Without detailed, real-time data, early warning signs are often missed until a major issue arises, forcing costly corrective measures. With bad supplier data costing businesses an average of $15 million annually, overlooking these details isn't just inconvenient - it’s a financial liability. This lack of precision also poses challenges for advanced systems that depend on structured, machine-readable data.
Modern AI-driven rating systems require clean, standardized data to function effectively. If your scorecard combines numeric metrics with free-text comments or subjective ratings, these tools struggle to interpret the information. Instead, using structured fields - like "Defect PPM + text summary of top 3 issues" rather than a generic 1–5 quality rating - can unlock the potential of automated, real-time supplier insights.
Core Metrics Every Supplier Rating System Needs
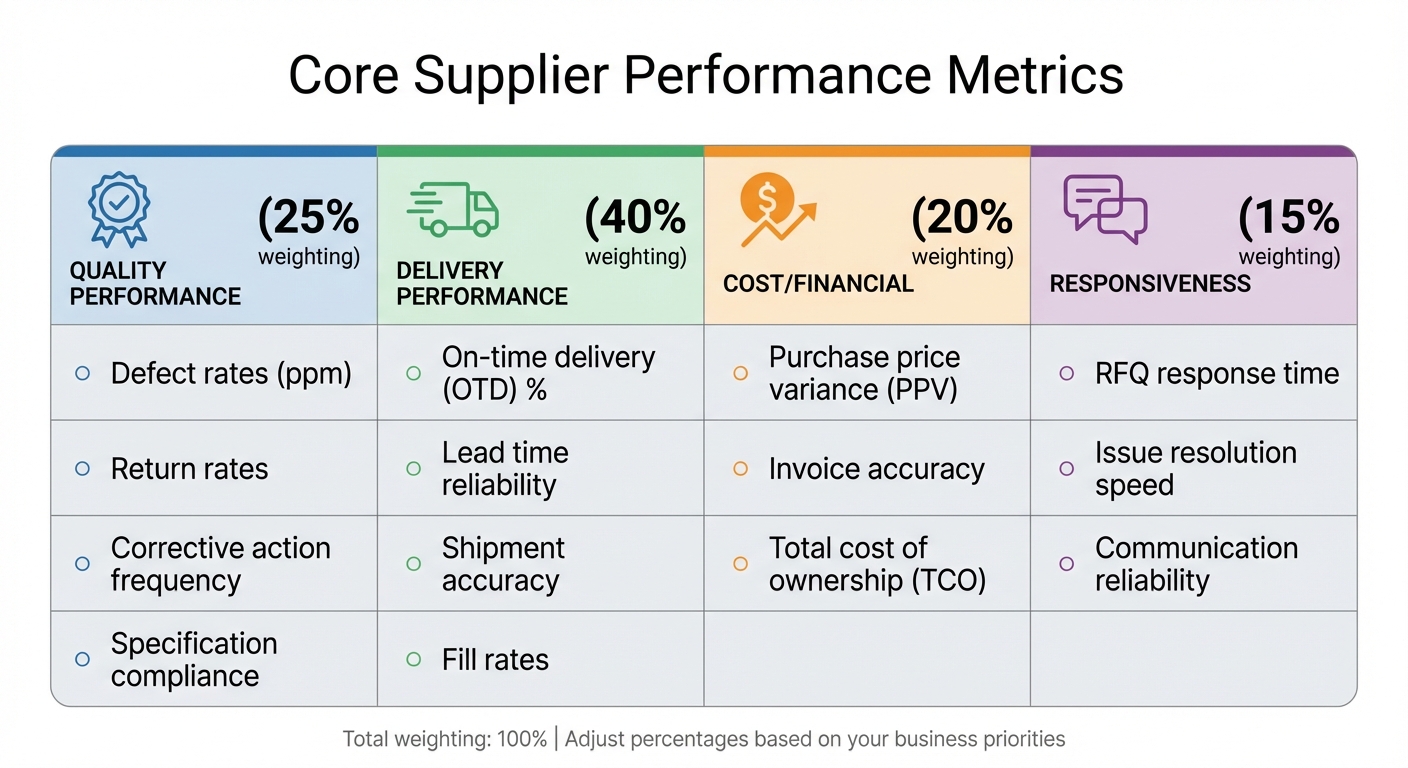
Core Supplier Performance Metrics: Categories, Indicators, and Weightings
To avoid the common pitfalls of subjective scoring and fragmented data, it's important to focus on measurable, objective indicators. A strong supplier rating system hinges on tracking performance in three key areas: quality, delivery, and cost/communication. These categories have a direct impact on operational efficiency and financial outcomes, and neglecting them can significantly increase risks.
The trick is to narrow your focus to 5–10 metrics that genuinely affect your operations. Trying to track too many metrics can dilute your efforts and create unnecessary complexity. Instead, choose metrics that lead to actionable insights. For example, measuring defect rates in parts per million (ppm) offers far more clarity than a vague 1–5 quality rating. These focused metrics become the foundation of an effective supplier scorecard, addressing the shortcomings of earlier systems.
Quality Performance Indicators
When it comes to quality, metrics should reflect defect rates, return rates, and how often corrective actions are needed. Defect rates measured in ppm are a precise way to track non-conformities, while return rates reveal the percentage of products sent back due to quality issues or mismatched specifications. Corrective action frequency highlights how often a supplier needs formal intervention to resolve recurring problems, and specification compliance shows how well products meet the contract's technical requirements.
For instance, a metric like "Defect ppm + summary of top 3 quality issues" provides a clearer picture than a generic quality score. This structured approach also allows AI systems to identify trends early, helping you catch potential disruptions before they escalate.
Delivery Performance Indicators
Delivery performance is all about reliability, and it’s measured through on-time delivery (OTD), lead time consistency, and shipment accuracy. OTD calculates the percentage of orders delivered on or before their due date, offering a straightforward way to track timeliness. Lead time reliability, however, digs deeper by looking at consistency rather than just average duration - high variability signals potential issues.
Shipment accuracy ensures that delivered quantities and items match the purchase order, while fill rates measure the percentage of an order fulfilled in the first shipment. Even a supplier with a high OTD can disrupt operations if lead times are unpredictable. A modern approach involves tracking "Rolling 12-month OTD % + standard deviation", combining overall performance with a measure of volatility.
Cost and Communication Indicators
Cost metrics go beyond just the price tag. For example, purchase price variance (PPV) measures the gap between the actual price paid and the budgeted cost. Invoice accuracy tracks how often billing errors occur, which can create manual work and delays. Communication is another critical factor, as poor responsiveness can be an early warning sign of deeper issues. Metrics like RFQ (Request for Quotation) response time, issue resolution speed, and communication reliability can help identify potential risks early.
Responsiveness typically accounts for about 15% of a supplier's weighted score in a standard scorecard. This ensures it has a meaningful impact without overshadowing the core areas of quality and delivery. Lastly, total cost of ownership (TCO) provides a more comprehensive view by including logistics, quality failures, and administrative costs, rather than just focusing on unit prices.
| Metric Category | Specific Indicators | Typical Weighting |
|---|---|---|
| Quality | Defect rates (ppm), Return rates, Corrective action frequency | 25% |
| Delivery | On-time delivery (OTD), Lead time reliability, Shipment accuracy | 40% |
| Cost/Financial | Purchase price variance (PPV), Invoice accuracy, Total cost of ownership | 20% |
| Responsiveness | RFQ response time, Issue resolution speed, Communication reliability | 15% |
How to Use the Weighted Point Method
The weighted point method transforms performance data into a numerical score, making it easier to evaluate and compare suppliers. By assigning specific weights to metrics, this approach aligns supplier evaluations with your business priorities. The process involves three main steps: assigning weights, scoring suppliers, and monitoring performance over time.
Step 1: Assign Weight Percentages to Each Metric
Start by determining which metrics are most important for your operations. The weight percentages should reflect your company’s strategy and procurement goals. For instance, if uninterrupted production is critical, you might assign 40% to delivery reliability. On the other hand, a company focused on premium products could prioritize quality with a 35% weight.
Document these weights clearly so they’re easy for your team and AI systems to interpret. A sample distribution might look like this: Quality 30%, Delivery 35%, Cost 20%, and Responsiveness 15%. However, these weights should be tailored to the supplier’s role. For example:
- A supplier providing basic commodities might have a higher cost weight.
- A strategic partner contributing to innovation might include an innovation category weighted at 10-15%.
Once you’ve finalized the weights, you’re ready to score your suppliers.
Step 2: Score Each Supplier and Calculate Totals
Evaluate each supplier using a 0-100 scale for every metric, based on performance data. For example, a supplier with a 94% on-time delivery rate would score 94 for delivery. Similarly, a defect rate of 200 ppm (parts per million) could translate into a quality score based on your internal benchmarks.
Next, multiply each score by its corresponding weight. For instance, if delivery is weighted at 40% and the supplier scored 94, the delivery metric would contribute 37.6 points (94 × 0.40) to their total score. Add up the weighted scores across all metrics to calculate the supplier’s final total. This method ensures unbiased, consistent, and comparable results across your supplier base.
Step 3: Track Performance with Quarterly Reviews
Ongoing reviews provide valuable insights into supplier performance. For critical suppliers, monthly or quarterly reviews are ideal to catch issues early. Standard suppliers can be monitored bi-annually. Strategic partners benefit from quarterly reviews combined with an annual in-depth evaluation.
These reviews should focus on identifying performance trends rather than isolated data points. For example:
- A score drop from 92 to 85 over two quarters signals a problem that requires immediate attention.
- Consistent improvement, such as moving from 78 to 88, shows a supplier is making efforts to strengthen the relationship.
Document these trends and use them during contract renewals or to make decisions about allocating more business. As SourceDay emphasizes:
"Supplier performance improves when expectations are clear and performance is measurable".
Regular supplier quality scorecards help establish these expectations, fostering accountability and driving better outcomes for both parties.
How AI Systems Change Supplier Rating
Traditional supplier evaluations often depend on spreadsheets, periodic reviews, and subjective assessments. In contrast, AI-powered platforms offer a more dynamic and data-driven approach. These systems create vendor profiles that update automatically as new information becomes available, eliminating the delays of quarterly reviews. For instance, instead of waiting months for performance data, businesses can receive instant alerts when shipping delays increase or defect rates exceed acceptable levels.
Automated Trust Scores from Multiple Data Sources
AI systems calculate trust scores on a scale of 0–100 by pulling data from three key sources: structured metrics (like those from ERP systems), unstructured text (such as contracts and performance reviews), and external signals (including credit ratings, news articles, and ESG disclosures). These trust scores are built on pre-defined metrics, ensuring continuous evaluation of critical factors like quality, delivery, and cost. Unlike traditional scorecards, which might only display averages, AI digs deeper. For example, it analyzes standard deviations to flag suppliers with inconsistent on-time delivery performance.
The financial stakes of poor supplier data are high - research shows that inaccurate supplier information costs businesses about $15 million annually. AI mitigates this risk by constantly verifying supplier credentials, monitoring transaction volumes, and scanning local news in over 100 languages. This multilingual capability helps detect regional issues that English-only systems might overlook.
Live Data Updates for Current Ratings
Traditional scorecards are static and can become outdated almost immediately. AI platforms address this issue by integrating directly with shipping carriers, quality control systems, and procurement databases. This enables supplier ratings to refresh in real time, reflecting the latest operational conditions. For example, when unexpected disruptions like factory fires or port delays occur, these platforms instantly update supplier scores and activate contingency plans. This level of responsiveness is crucial, especially since 70% of companies report increased supply chain risks over the past three years.
Side-by-Side Comparison Features
AI also simplifies vendor comparisons with tools that standardize and clarify unstructured quotes. Bid leveling features transform vendor data - often buried in PDFs - into clear, standardized formats. This makes it easier to identify scope deviations and assumption gaps, enabling objective, side-by-side comparisons of performance metrics.
"Instead of static scorecards updated once a quarter, language models can synthesize performance data, contracts, news, and risk signals into dynamic, explainable rankings that mirror human judgment at scale." – Single Grain
Some advanced platforms can even map hidden Tier 2 and Tier 3 suppliers, uncovering hidden risks where multiple vendors rely on the same source. This kind of visibility is nearly impossible to achieve manually. By combining real-time updates and comprehensive scorecard analysis, AI offers a more complete and actionable view of supplier performance.
Supplier Scorecard Template You Can Use
What to Include in Your Scorecard
Start by including three essential fields: Supplier Name, Reporting Period, and Evaluator's Name.
The main part of the scorecard should focus on four performance categories:
- Delivery Performance: Measures on-time delivery percentage and how reliably suppliers meet promised lead times.
- Quality Performance: Tracks defect rates, return frequency, and corrective action requests.
- Responsiveness: Assesses how quickly suppliers respond to changes in purchase orders or resolve issues, typically measured in hours or days.
- Cost Performance: Compares pricing against market standards and monitors invoice accuracy.
Assign weight percentages to each category (e.g., 40% for delivery performance) to prioritize areas that matter most to your business. Use a standardized 1–5 scoring scale to make evaluations consistent and comparable. Include a Weighted Score (calculated as Raw Score × Weight) for an overall rating.
For example, one manufacturer faced repeated re-evaluations of the same eight suppliers due to unorganized records. Structured scorecards help avoid such inefficiencies. Adding a Comments field can further clarify scores and provide actionable feedback for suppliers.
"The weighting discussion is where the real strategic debate happens - it's not about math, it's about what your organization truly values." – Wicely Team
This template ensures evaluations are based on data, making the process both practical and improvement-focused.
Sample Scorecard Format
Below is a sample scorecard format that you can adapt to fit your needs. It uses a 1–5 scoring scale with weighted calculations:
| Performance Category | Weight | Raw (1-5) | Calculated Score | Comments |
|---|---|---|---|---|
| Delivery Performance (OTD, Lead Time) | 40% | 4 | 1.6 | 94% OTD; occasional 1-day delays |
| Quality Performance (Defects, Returns) | 25% | 5 | 1.25 | Defect rate < 0.5%; zero returns this quarter |
| Cost Performance (Price Stability, TCO) | 20% | 3 | 0.6 | Prices stable but 8% above market average |
| Responsiveness (Communication, Support) | 15% | 4 | 0.6 | Responds within 24 hours; proactive updates |
| TOTAL SCORE | 100% | N/A | 4.05 / 5.0 | Strong performer; monitor pricing |
To ensure consistency, define what each score represents. For instance:
- 5 (Exceptional): Exceeds expectations significantly.
- 4 (Strong): Fully meets expectations with notable strengths.
- 3 (Adequate): Meets basic requirements without standing out.
- 2 (Weak): Partially meets expectations, with clear gaps.
- 1 (Poor): Fails to meet critical requirements.
Integrating ERP data can minimize manual errors. For critical suppliers, consider monthly reviews. Quarterly evaluations work well for strategic partners, while annual reviews are sufficient for lower-risk vendors.
Conclusion
Supplier rating systems take the guesswork out of evaluating performance by using standardized metrics and objective data. By focusing on 5–10 key areas such as quality, delivery, cost, and compliance, businesses can make more informed decisions. The weighted point method is a straightforward way to measure supplier performance: assign percentage weights to each metric, score suppliers consistently, and review results at intervals that match their importance to your operations.
Modern technology has transformed this process by automating data collection and enabling real-time monitoring, replacing outdated annual reviews. Keeping tabs on dynamic data is crucial for a resilient supply chain. AI-powered tools can flag potential issues, like payment delays or factory disruptions, before they turn into major problems. Consider this: inaccurate supplier data costs businesses an average of $15 million annually, and supply chain disruptions can slash 62% of a company’s profits. These numbers highlight why adopting a proactive, data-driven approach is so critical.
"Evaluating supplier performance isn't just paperwork - it's about building a supply chain that helps your business thrive." – esgrid.com
This statement underscores the importance of clear strategies. Start by evaluating your top five critical suppliers. Integrate performance standards into contracts, hold regular review sessions to ensure fair scoring, and use your rating system as a way to encourage collaboration rather than as a punitive tool. Research shows that companies working closely with their suppliers grow twice as fast as those that don’t.
If you're looking for a smarter way to manage supplier performance, ForthSource offers real-time insights powered by AI. Their Trust Scores improve accuracy and make supplier evaluations more effective. Plans include Free ($0/month) for basic searches, Premium ($29/month) for advanced tools like shipping cost calculators, and Enterprise ($99/month) for unlimited searches. Visit their Supplier Ratings Key Metrics To Watch page or start building your supplier rating system today.
FAQs
What is a supplier rating?
A supplier rating system is a structured method for assessing and ranking suppliers based on crucial factors such as performance, quality, delivery, and risk. By relying on data, this approach enables organizations to make smarter decisions and maintain stronger, more efficient supplier relationships.
What supplier rating metrics matter most?
Key metrics for evaluating suppliers focus on a few essential areas:
- Delivery performance: This includes how consistently suppliers meet delivery schedules and whether their lead times align with expectations.
- Quality: Factors like defect rates and adherence to compliance standards play a major role here.
- Cost management: Assessing whether suppliers provide good value for the money spent is critical.
- Risk management: This involves looking at financial stability and geopolitical factors that could impact supply.
- Responsiveness: Timely communication and the ability to adjust to changing circumstances are key indicators.
Using a weighted scoring model allows businesses to rank these metrics based on their importance. This approach helps ensure dependable supplier performance and minimizes potential disruptions.
How do I calculate a supplier rating score?
A supplier rating score is determined by assessing critical performance factors such as quality, delivery, cost, compliance, and innovation. Each of these factors is given a specific weight that reflects its importance to the business. Suppliers are then scored on a scale (for example, 1 to 10) for each criterion. These scores are multiplied by their assigned weights, and the resulting weighted scores are added together. The final score provides an overall rating, allowing companies to compare suppliers and pinpoint areas where improvements are needed.